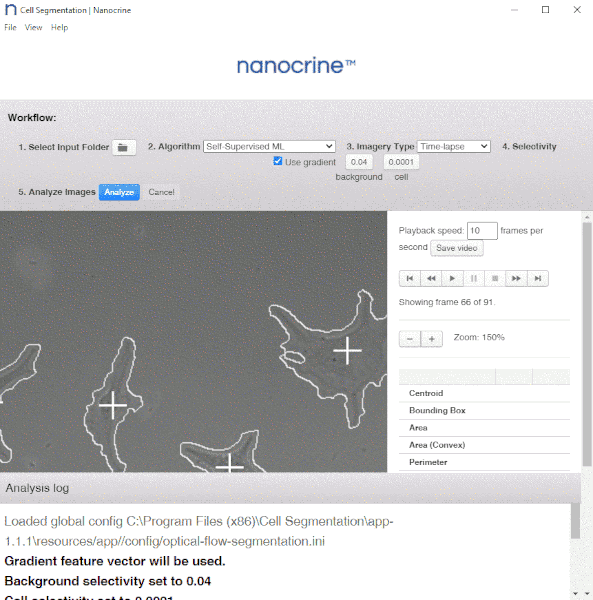
Nanocrine’s NanoMAML software turns segmentation and analysis into an automated process. NanoMAML measures the optical flow of all regions within each frame of an image set from a live cell experiment to identify regions occupied by cells.
NanoMAML Dashboard
How does it work?
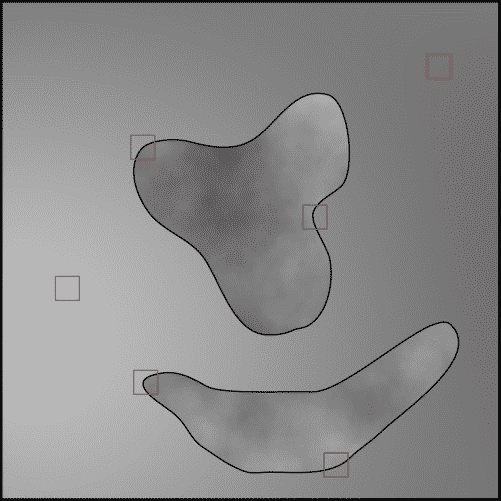
A static cell can be easily discerned visually from its background by a human, but a single experiment likely contains hundreds of cells over hundreds of frames. Segmenting image sets by hand is tedious and prone to error as a result.
Groups of pixels are identified as belonging to a cell by their movement
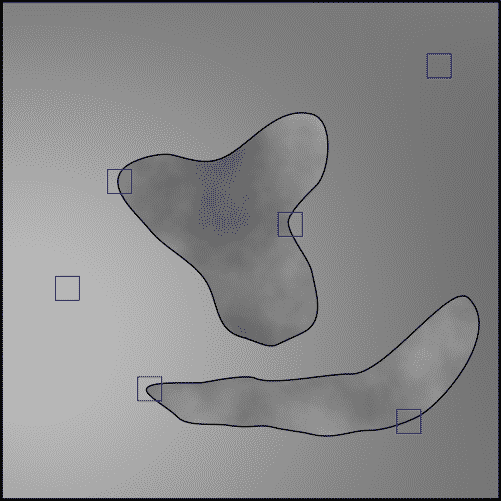
Between successive frames taken over a period of time, however, cells appear as dynamic systems full of movement. If a cell were to move to the left during an experiment, the static background would remain unchanged while the contour of the cell could be observed to move independently. Even without bulk movement, a cell will exhibit changes in shape while remaining in the same spot between frames. Either way, this movement can be used to differentiate a cell from its background.
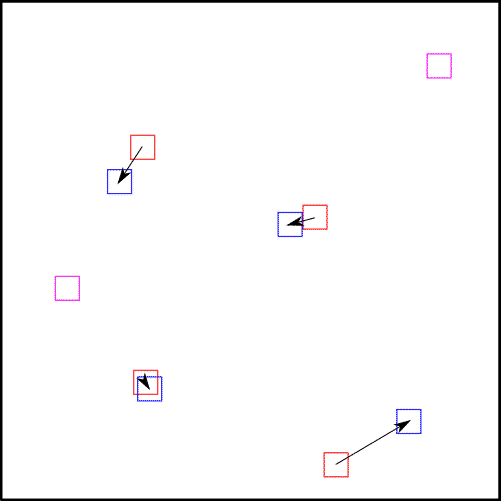
Arrows indicate optical flow above a specified threshold between two frames
NanoMAML uses this movement to autonomously perform segmentation on image sets. The Farneback optical flow algorithm measures the amount that a region appears to move, the “optical flow,” between successive frames. Since the background will not appear to move, any region with zero optical flow will be categorized as “background.” The end result is a mask of cell outlines which can be analyzed computationally.
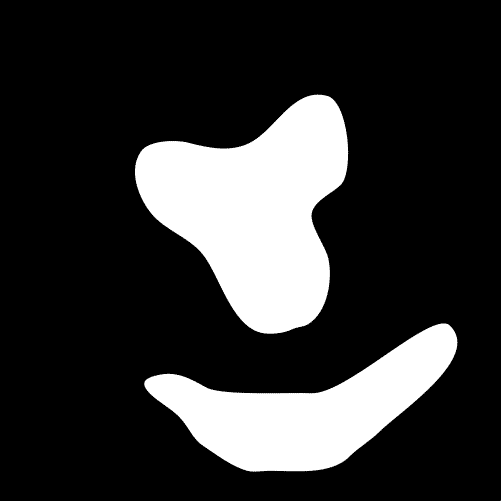
Automatically generated binary mask
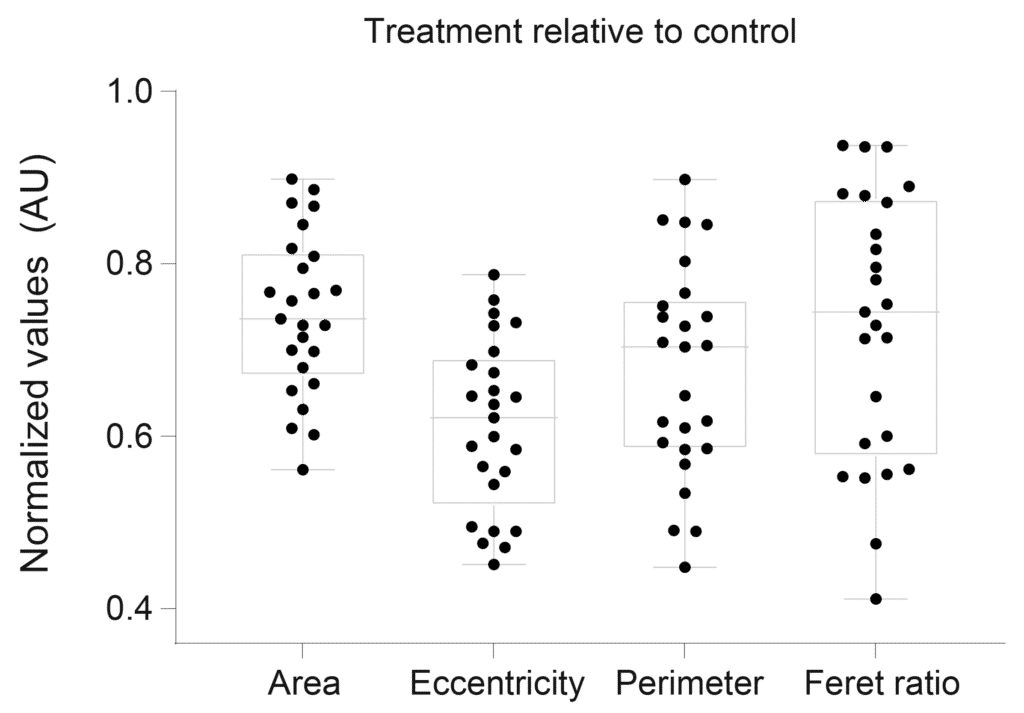
Our goal is to streamline the process from experiment to publication. In addition to producing segmented cell masks for use in computational analysis, NanoMAML also computes standard statistics about cell shape.
After the segmentation is complete, NanoMAML will automatically load the masks into a series of algorithms and output extensive data alongside the masks themselves. The data is output in CSV format for easy use with popular graphing and statistical software.
Summary data of cell parameters
Inquire at info@nanocrine.com to receive a license key for NanoMAML.